FinOpsAid — the GitHub spend no one is metering

FinOpsAid is a FinOps console for GitHub. It meters Copilot seats, AI credits, GitHub Actions minutes, Codespaces and storage — snapshotted nightly, attributed to teams, forecast, and reconciled against your real invoice, so the cost GitHub never itemizes becomes dollars you can act on.

Pricing · About · Connect your GitHub org (free, read-only)

Metering the invisible

The GitHub spend
no one is metering.

Copilot seats, AI credits, Actions minutes, Codespaces, storage, and self-hosted runner fleets — snapshotted nightly, attributed to teams, forecast, and reconciled against the bill. The telemetry GitHub throws away in 100 days, kept and turned into dollars.

  • 19 connectors
  • SCD2 warehouse — history is never overwritten
  • MoM / YTD forecasts & CSV·Excel·JSON export
  • k-anonymity-gated benchmarks

Where it leaks

Money escapes through the gaps GitHub leaves uncounted.

None of these show up as a line item. Every one is a number we can put on the table this week.

SEAT·IDLElicense waste
One in five Copilot seats goes a full month without a keystroke — and you're billed for every one of them.
$226K/ yr reclaimable
RUN·BURNcompute
Self-hosted runners sit idle at an hourly cost GitHub never surfaces. We model it from your infra rates.
286runners, modeled
CDSP·IDLEcodespaces
Codespaces left running idle or over-provisioned burn spend GitHub bills as one org lump. We flag idle and oversized machines from the daily snapshot.
IDLE+ oversized, flagged
STOR·CREEPstorage
Actions artifacts, packages, and LFS quietly accrue storage cost. We itemize it by category instead of leaving it a single line on the invoice.
×5categories, billed $
CR·DRIFTreconciliation
Credit signals drift from the invoice and never reconcile themselves. We anchor every signal to billed dollars.
±10%signal vs. billed
REPO·BLINDattribution
GitHub won't attribute Copilot cost to a repo or team. Our model does — and labels it an estimate, every time.
ESThonestly marked

Signal vs. billed

A usage signal is not a dollar. We meter the signal, anchor it to the billed truth, and show you the gap.

ai_credits_used is a single daily per-user number — a hint, never an invoice. Money comes from the billing API. Most tools quietly conflate the two and call it a dashboard. We don't. We reconcile; we never conflate.

How it meters

A pipeline that assumes GitHub's history is already disappearing.

Metrics retain roughly a year, reports about a hundred days. What we don't capture tonight is gone. So we capture all of it — nightly, versioned, attributed.

01 / connect
Nineteen connectors
GitHub App tokens only, never PATs. ETag-aware, rate-limit-polite, version-pinned.
02 / snapshot
Nightly capture
Everything dated, every night — because ephemeral telemetry doesn't wait.
03 / warehouse
SCD2 history
Versioned, never overwritten. Drift and benchmarking depend on keeping every prior truth.
04 / attribute
Cost model
Credits become a modeled per-team, per-dev share — marked EST, never disguised as billed.
05 / surface
Intelligence
Executive overview, run-rate forecasts, license & Codespaces waste, storage by category, governance — served from our DB, exportable to CSV·Excel·JSON.

See it in action

The intelligence, on screen — not a slide deck.

Real dashboards from the demo workspace. Every modeled figure is labeled an estimate; every number carries an as-of date.


FinOpsAid executive overview: projected spend $91,172, budget utilization, spend YTD $94,084, potential savings $16,907, and a health score of 88.
Executive overview — projected spend, budget, potential savings and a FinOps health score at a glance.
Copilot KPI row: total spend $87,034, 170 active users of 185, 32% acceptance rate, 142.8K interactions, 46K acceptances, 82.9K AI credits.
Copilot, at a glance — spend, active seats, acceptance rate and interactions in one strip.
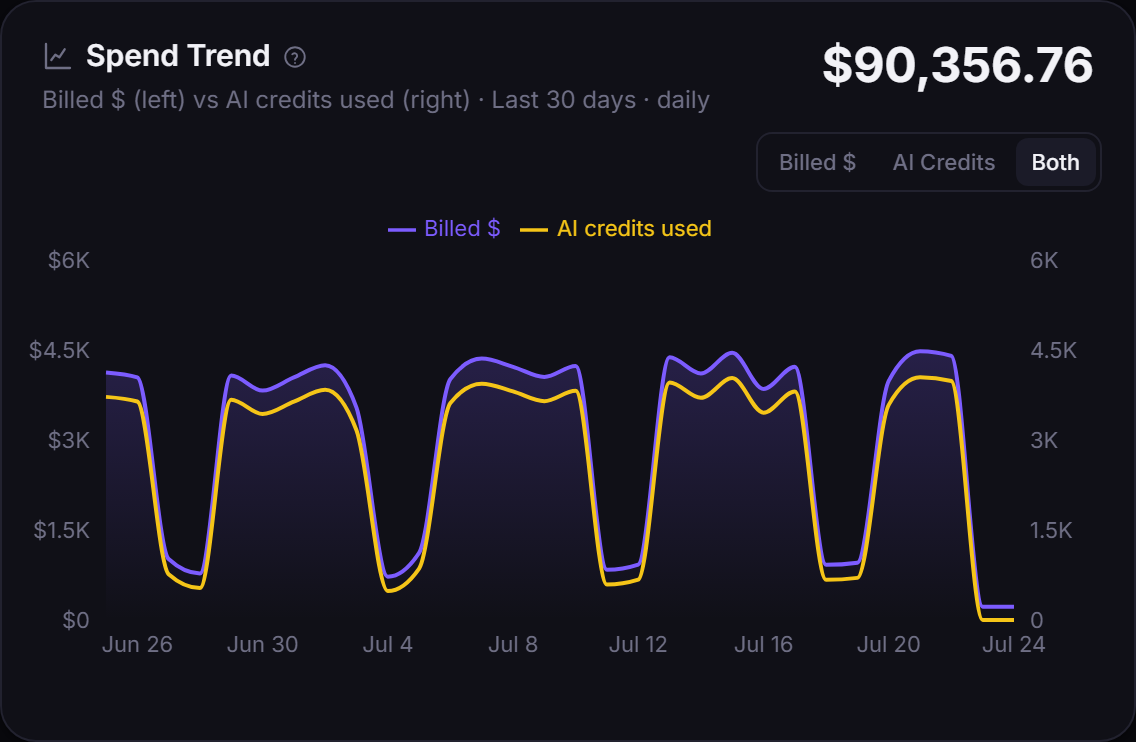
Spend Trend chart plotting billed dollars against AI credits used over the last 30 days.
Spend trend — billed dollars vs. AI-credit usage, reconciled daily so the signal never poses as the invoice.
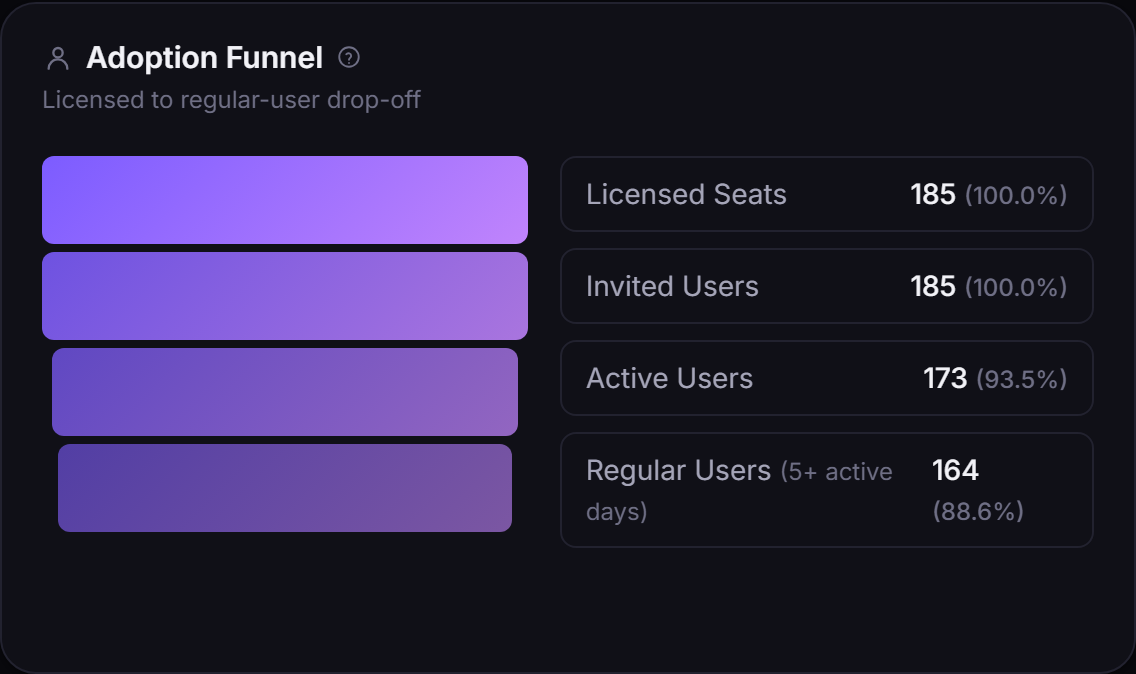
Copilot adoption funnel: 185 licensed seats, 185 invited, 170 active, 164 regular users.
Copilot adoption — licensed → invited → active → regular, so the drop-off you're paying for is impossible to miss.
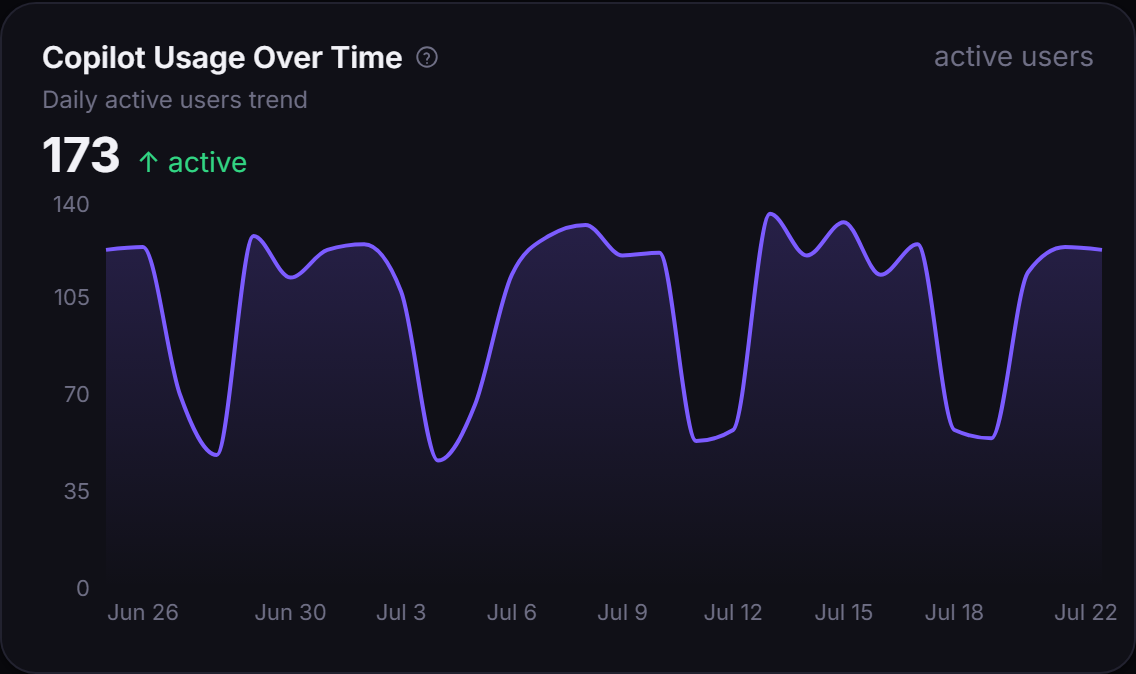
Copilot usage over time: daily active-user trend across the period.
Copilot usage over time — the daily active-user trend, so adoption is tracked, not guessed.
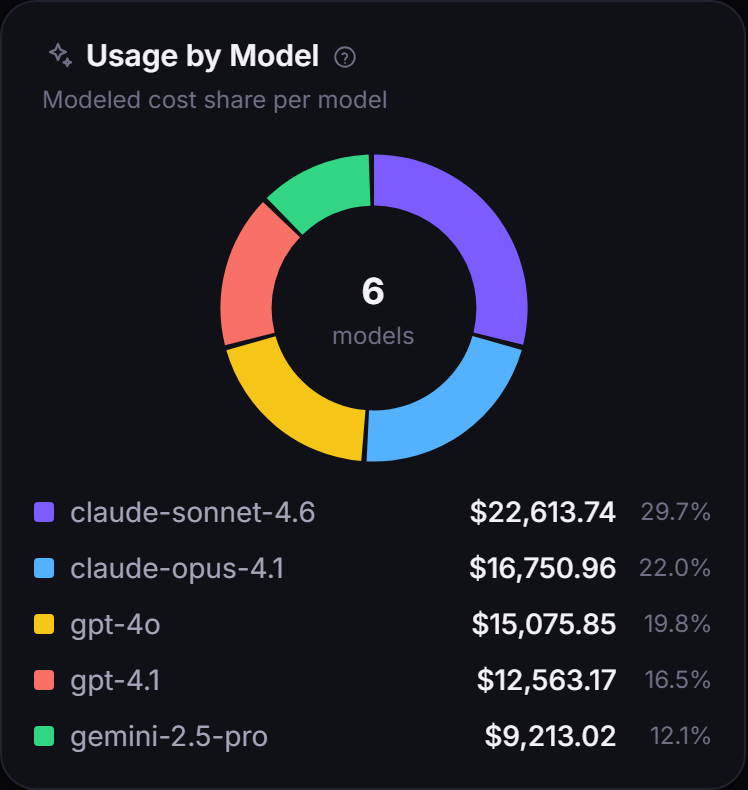
Copilot usage by model: modeled cost share across six models, led by claude-sonnet.
Usage by model — modeled cost share per model, surfacing the frontier-model share that drives cost.
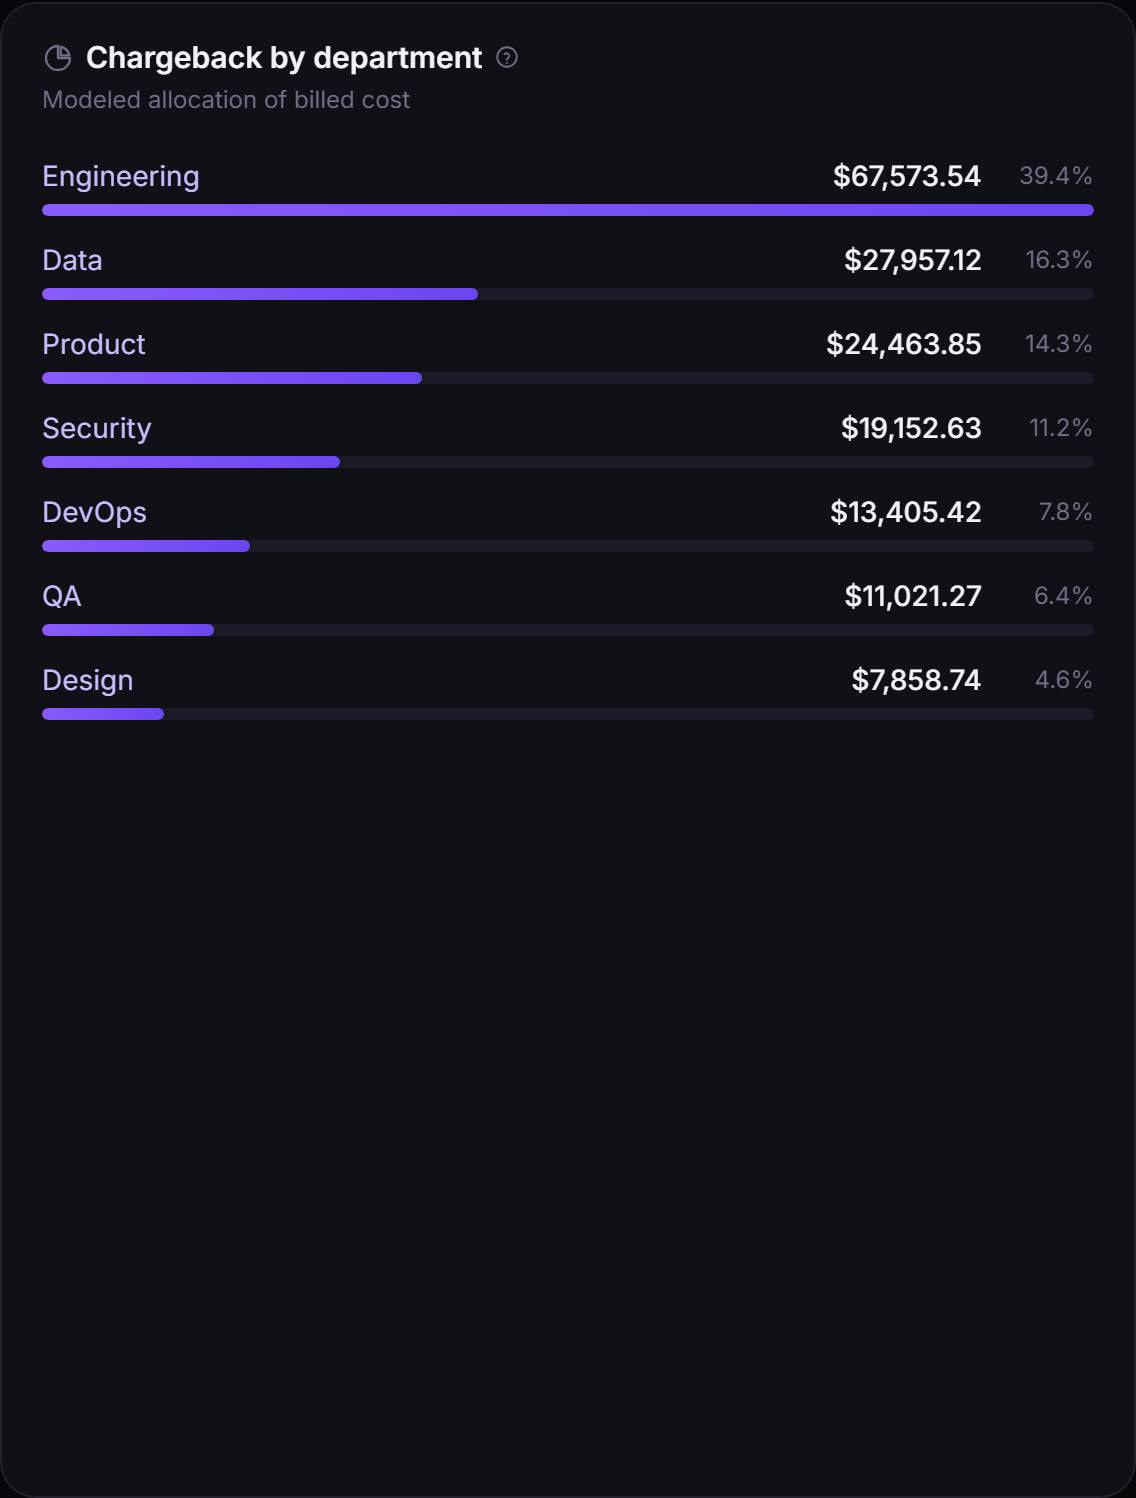
Chargeback by department: modeled allocation of billed GitHub cost across Engineering and other departments.
Chargeback by team — modeled cost allocation, so spend has an owner. Labeled an estimate, every time.
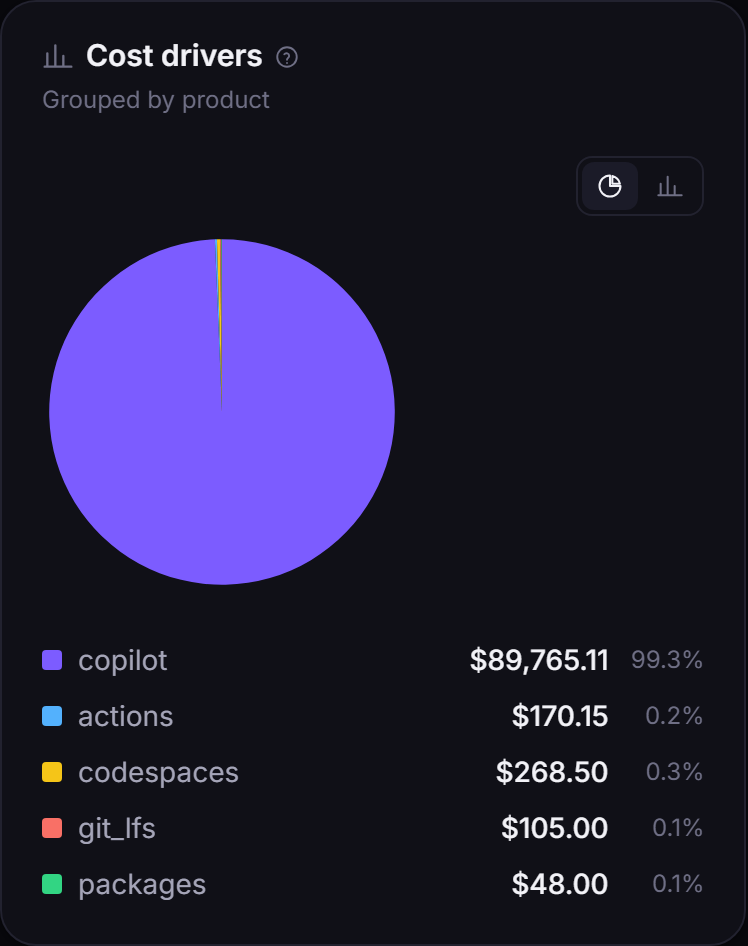
Cost drivers grouped by product and ranked by share of spend.
Cost drivers — what moved spend this period, grouped by product and ranked.
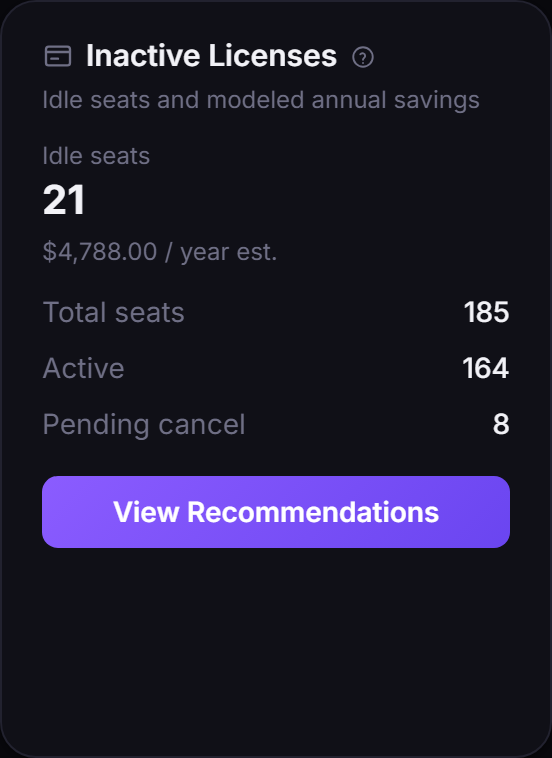
Inactive Licenses card: 21 idle Copilot seats costing an estimated $4,788 per year.
License waste — idle Copilot seats and the modeled annual cost of leaving them running.
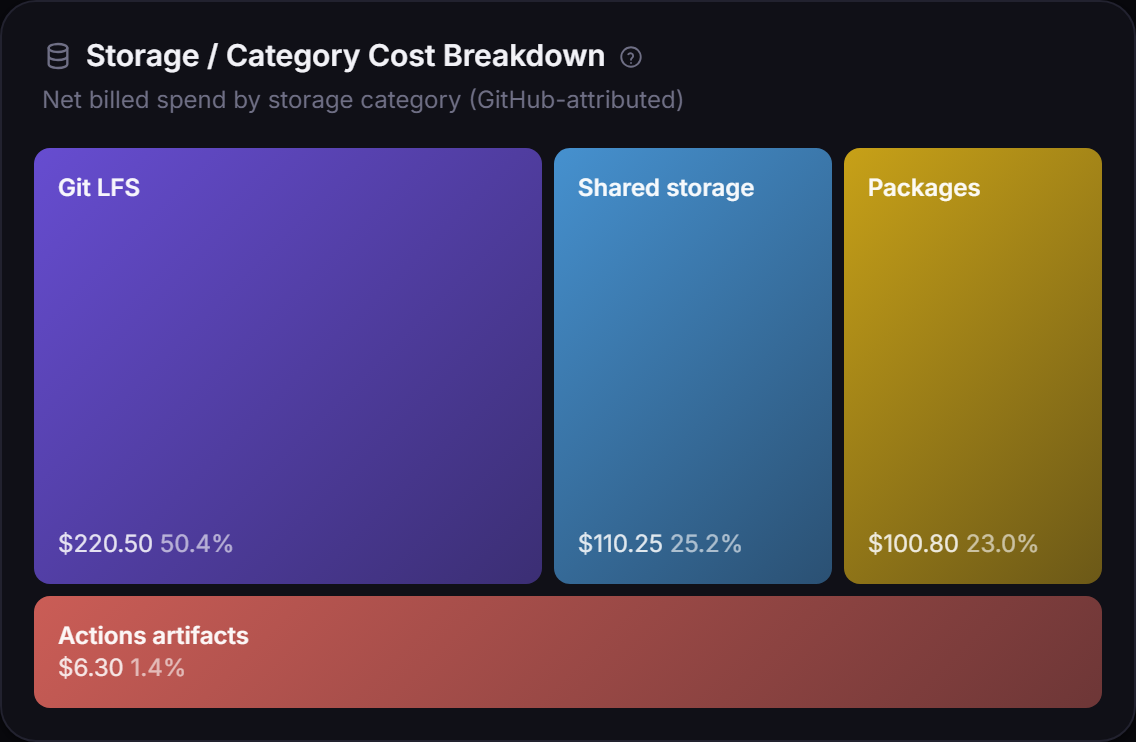
Storage cost by category treemap: Git LFS, packages, shared storage and Actions artifacts as billed dollars.
Storage by category — Git LFS, packages, shared storage and Actions artifacts, each as billed dollars.
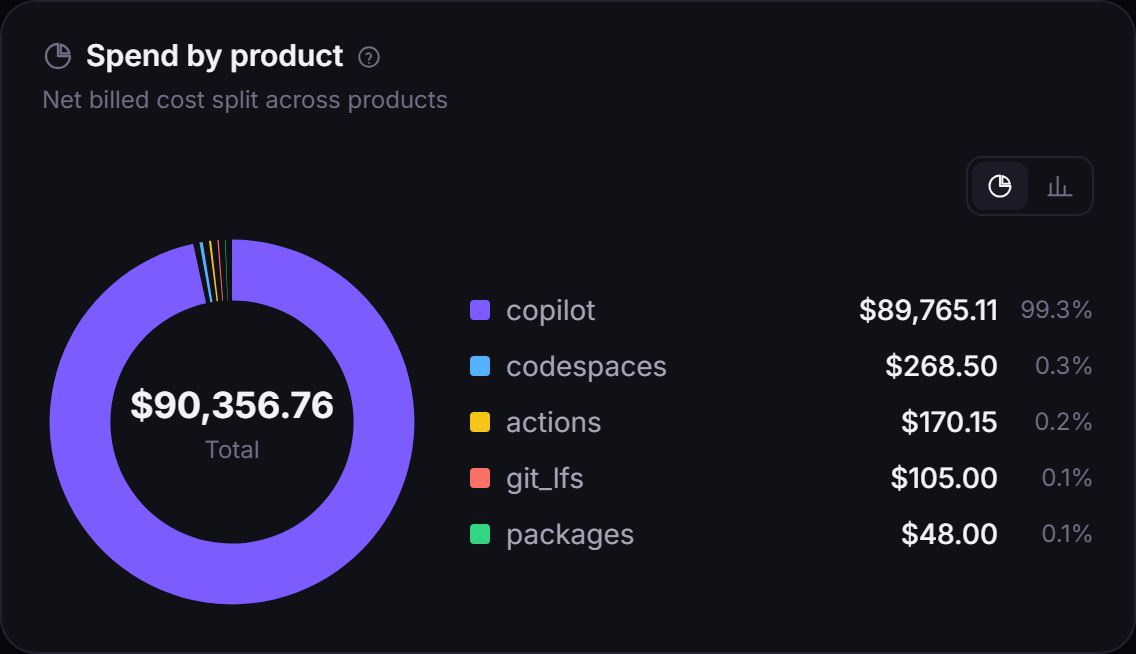
Spend by product donut: Copilot, Actions, Codespaces and storage split from one org bill.
Spend by product — Copilot, Actions, Codespaces and storage, split out of one org bill.
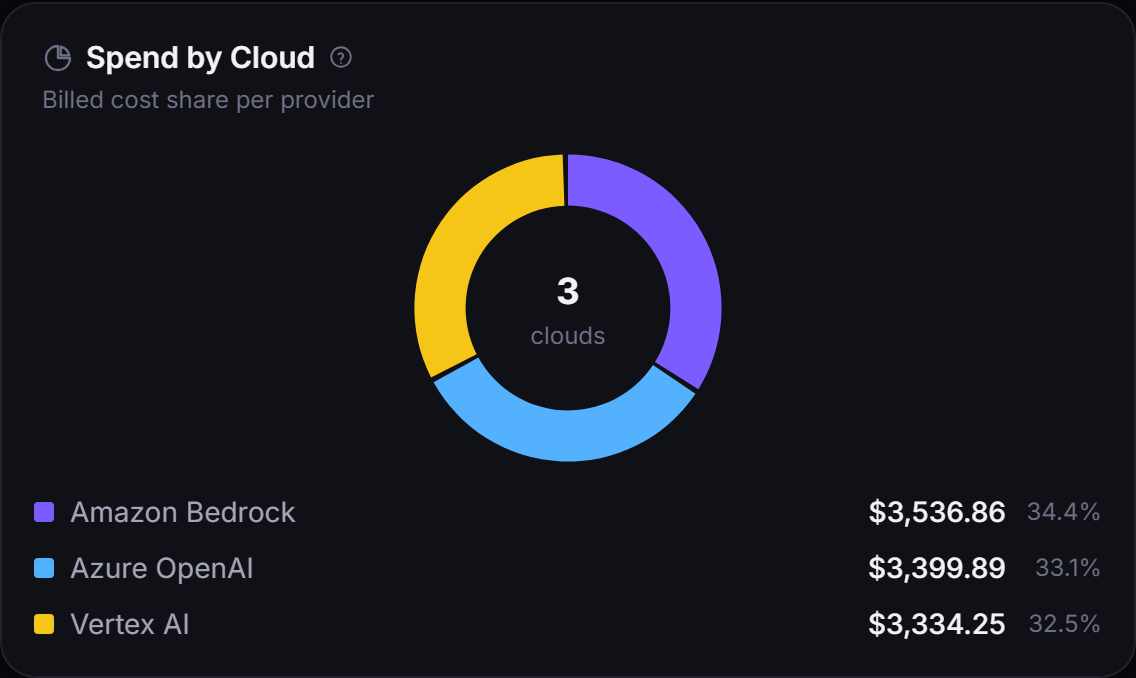
Cloud AI spend by cloud donut: Vertex AI, Azure OpenAI and Amazon Bedrock shares.
Cloud AI split — Vertex, Azure OpenAI and Bedrock LLM spend, unified in one view.
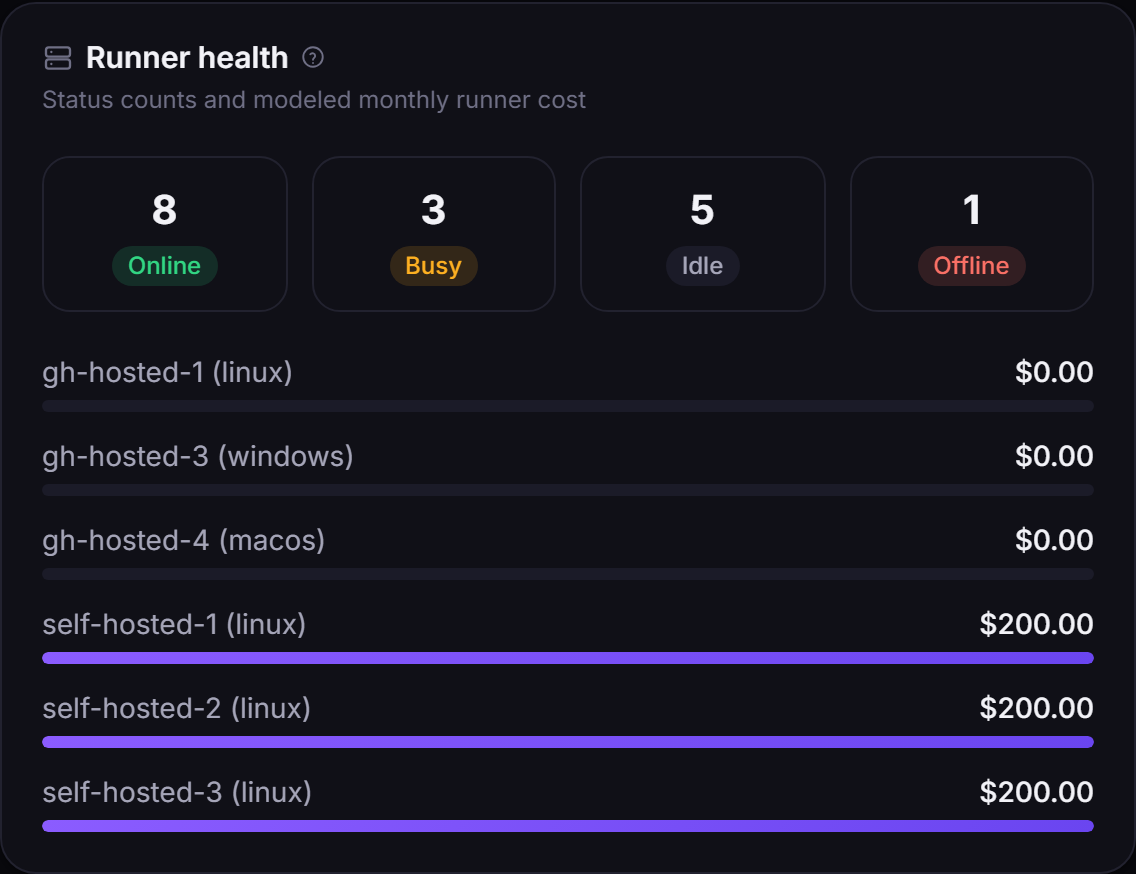
Runner health: online, busy, idle and offline counts with modeled monthly cost per self-hosted runner.
Runner health — online, busy, idle and offline, with modeled monthly cost per runner.
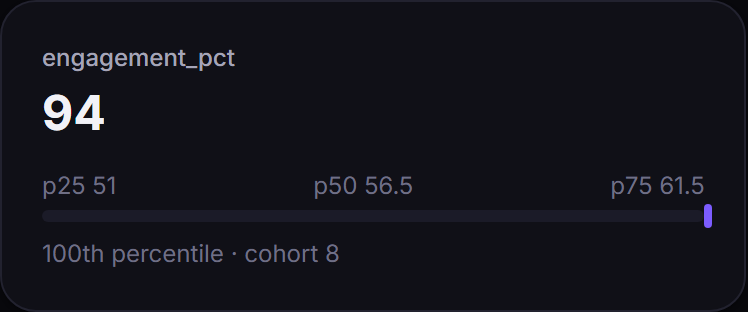
Benchmarking: engagement percentile against an anonymized cohort at p25, p50 and p75.
Peer benchmark — where you land against the p25/p50/p75 of an anonymized cohort.
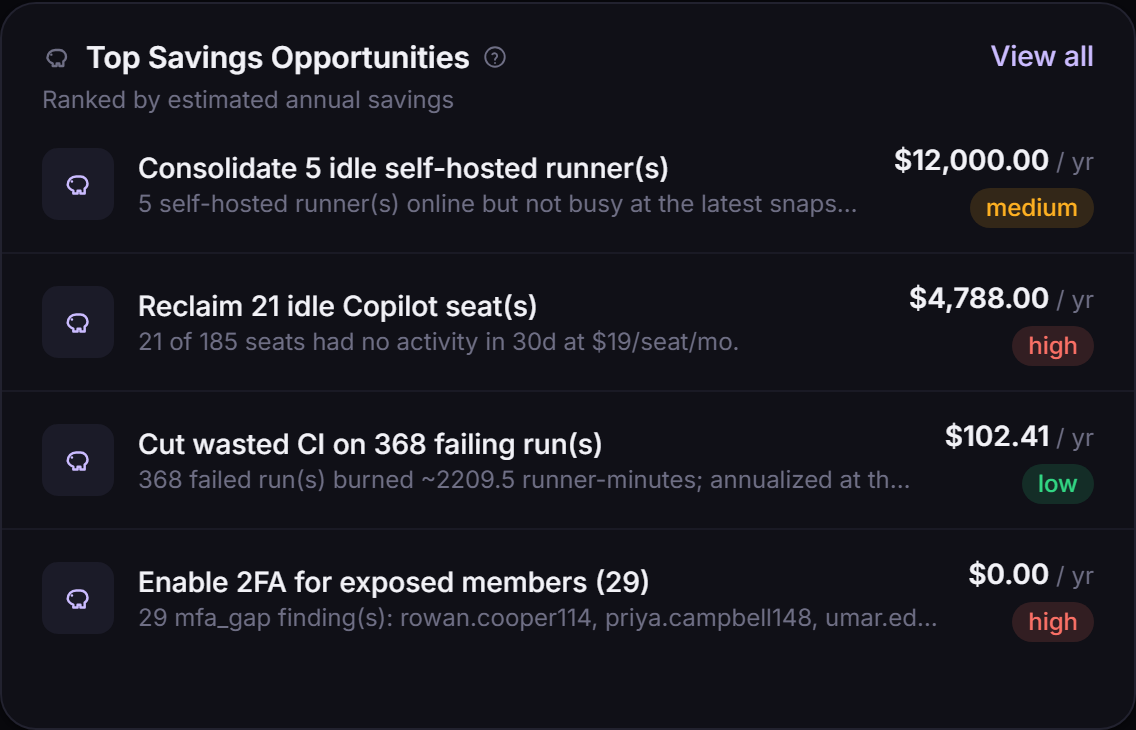
Top savings opportunities ranked by estimated annual savings: consolidate idle self-hosted runners, reclaim 21 idle Copilot seats for $4,788/yr, cut wasted CI, enable 2FA.
Ranked savings — every opportunity with an estimated annual dollar figure and a confidence label.
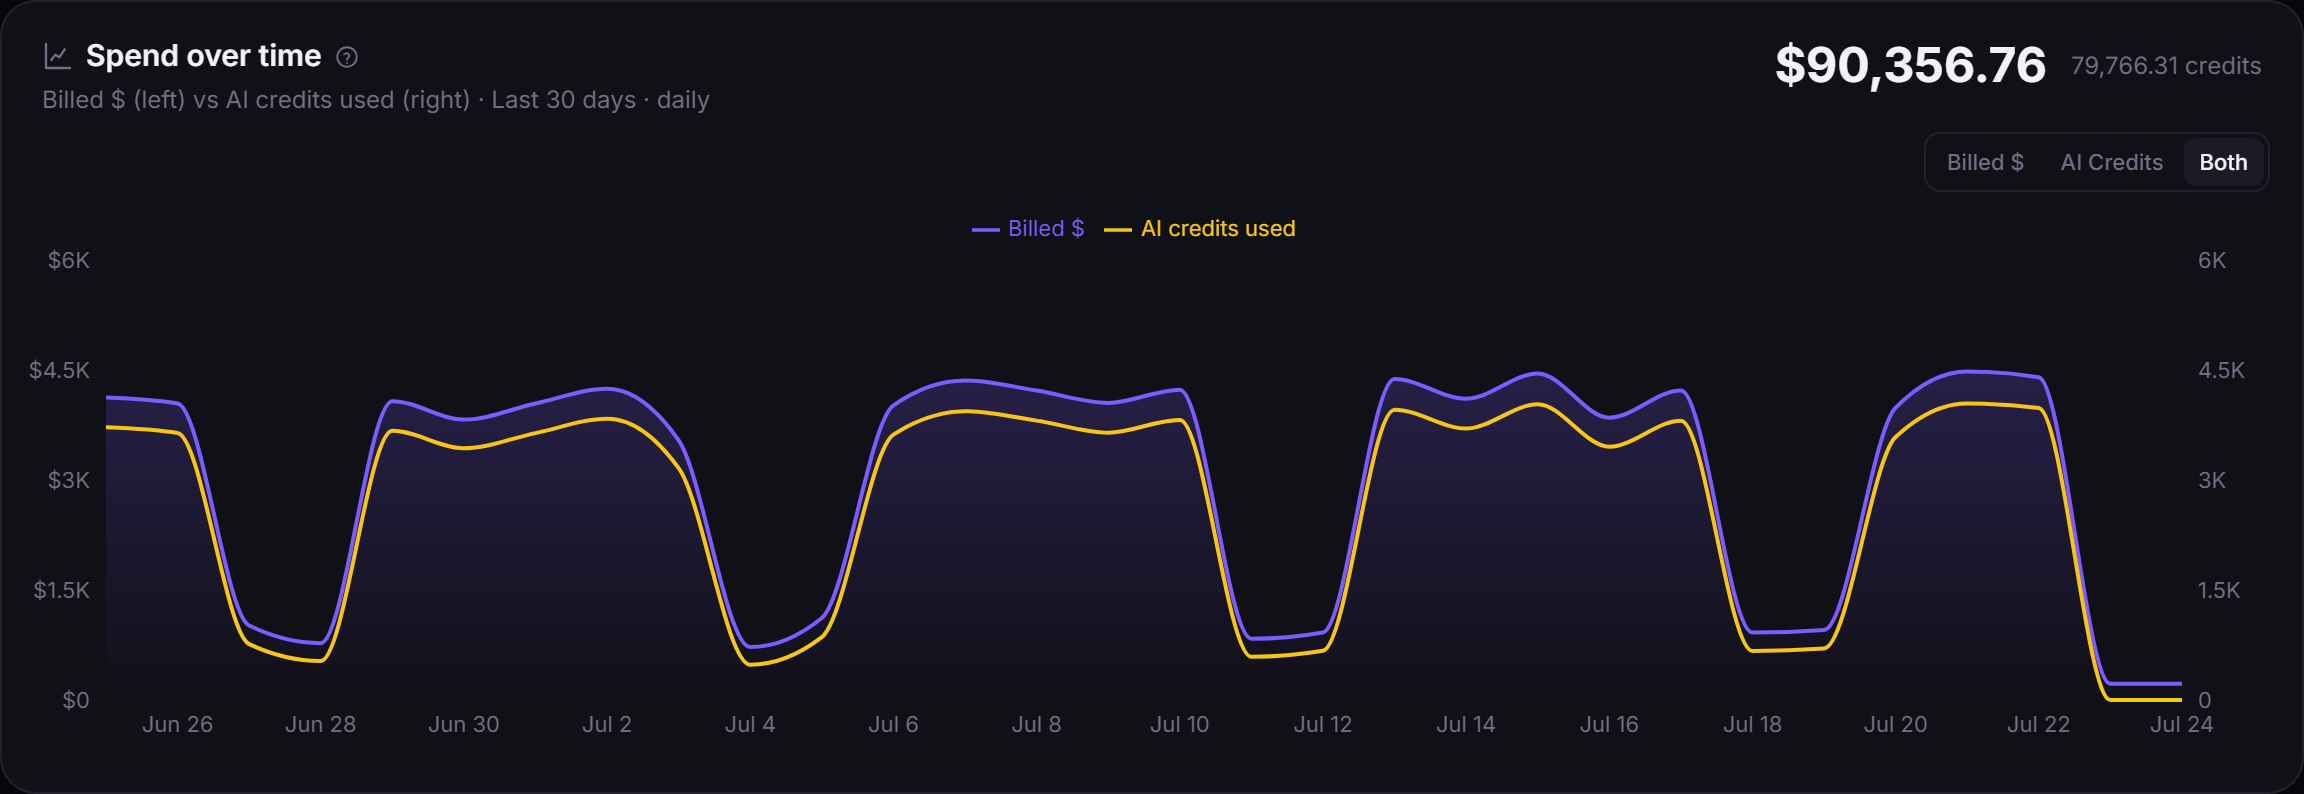
Cost Explorer spend over time: billed dollars versus AI credits used across the last 30 days with a forecast.
Every dollar over time — the full cost trend from Cost Explorer, billed vs. credits, with a forecast.
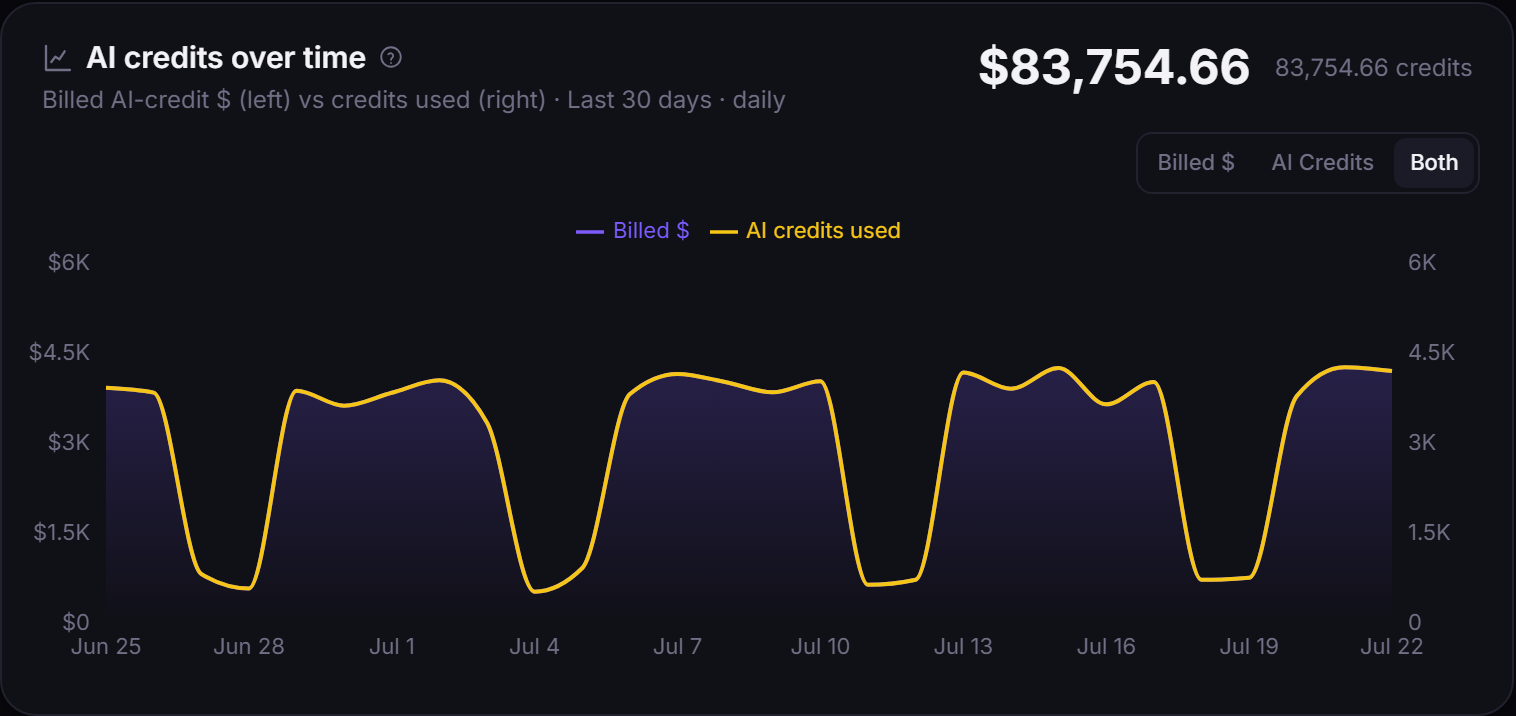
AI credits over time: billed AI-credit dollars against credits consumed on a dual axis.
AI credits over time — billed credit dollars vs. credits consumed, on one dual axis.
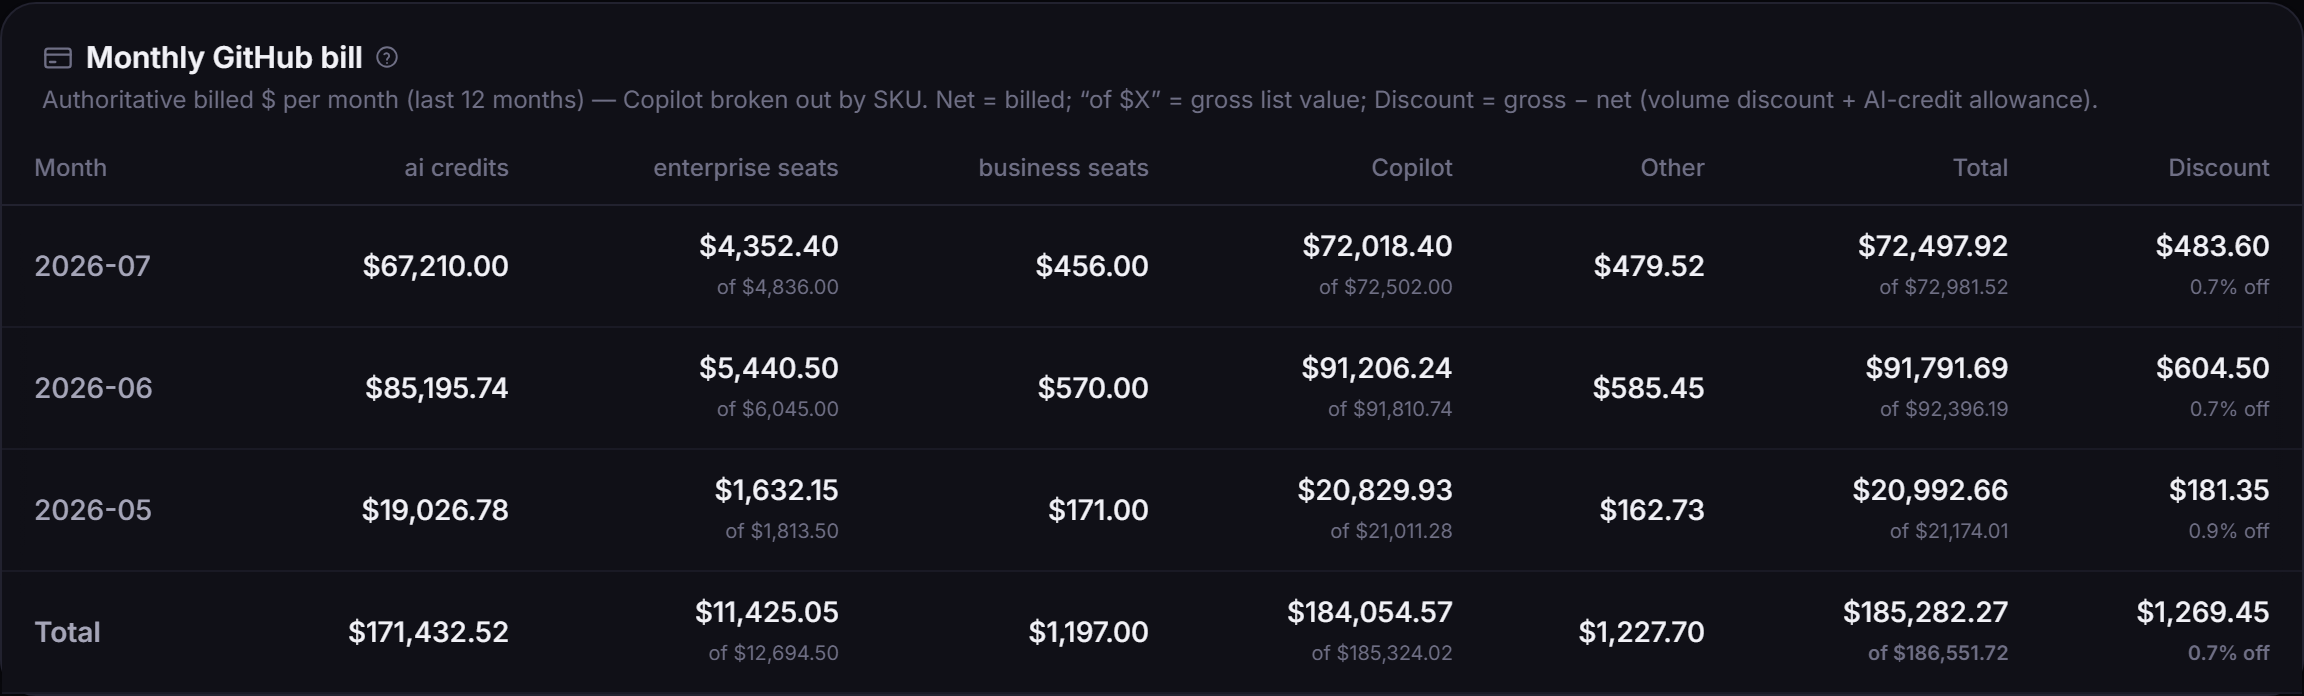
Monthly GitHub bill: authoritative billed dollars per month with Copilot broken out by SKU.
The monthly bill — authoritative billed dollars per month, Copilot broken out by SKU.
Claude cache efficiency: cache-read share of base input tokens, the biggest lever on token cost.
Cache efficiency — cache-read share of Claude input, the single biggest lever on token cost.

We hold billing, per-developer, and permissions data for many tenants. The guardrails are the product.

Read-only
We never write back to GitHub. No seat or permission changes, ever — unless you scope that decision separately.
Permission-gated
Per-developer leaderboards support an aggregate-only mode. Monitoring-sensitive views stay behind permissions.
k-anonymity
Benchmarking is the only cross-tenant path — aggregated, opt-in, and suppressed below cohort k.
Marked estimates
Anything modeled is labeled EST in the UI. We'd rather show the gap than paper over it.

Get started

Meter one month of your GitHub bill — free.

Explore the live demo, or connect a read-only GitHub App and give us a nightly sync. We'll hand you the idle seats, the runner burn, and the credit drift in a week. No write access. No PATs.